

Xmaster Formula Indicator was developed by the xmasterformula.com just as the name suggest, the indicator ensures that you trade as a forex master. It is best for even the Forex Beginners.
The indicator is displayed on a separate chart below the main trading chart. It is responsible for the display of green and red dots that are arranged in a wave line form. The dots follow the trend of the market. The indicator also displays yellow arrows, which are usually the main signal. The green dots shows that the market prices are on the rise while the red dots shows that the market prices are on a down ward trend. Another thing worth noting is that the green dots are usually thinner than the red dots. Therefore, there is nothing wrong with the size of the green dots and it doesn’t mean that the trade is week as some traders may opt to think.

From the chart above it is evident that the indicator leaves the main trading chart very clean and the trader is at liberty to and any other indicator of his will. For example in the above chart there is an ask-bid spread indicator that is added to show the ask line level, the bid line level and the spread of the current currency pair being traded or whose chart is opened.
The indicator is not a very good choice if you decide to use it alone. This is because, the indicator gives its signals very sparingly and it takes time before it gives another signal. Therefore if the trader meets the indicator had given a signal four bars before, he or she may be confused on whether to place an order or not. However if the trader incorporated another indicator, it would be easier for him or her to know whether the signal that the Xmaster Formula indicator had given is still valid at whatever time you open the market to trade.
Placing trades if using the Xmaster Formula indicator alone.
The trader should wait for the yellow arrow to first appear. Then the trader should not wait for the next candles to start to form the yellow arrow is displayed. Therefore you should not be in a hurry to place your order immediately an arrow is displayed; the market trend at this time is usually very young and tender to trust and should be given some time to place a trade.
When a yellow arrow appears facing up, then the trader should place a BUY order. On the other hand a yellow arrow facing down appears, the trader should place a sell order.
Example of placing order using the Xmaster Formula indicator.
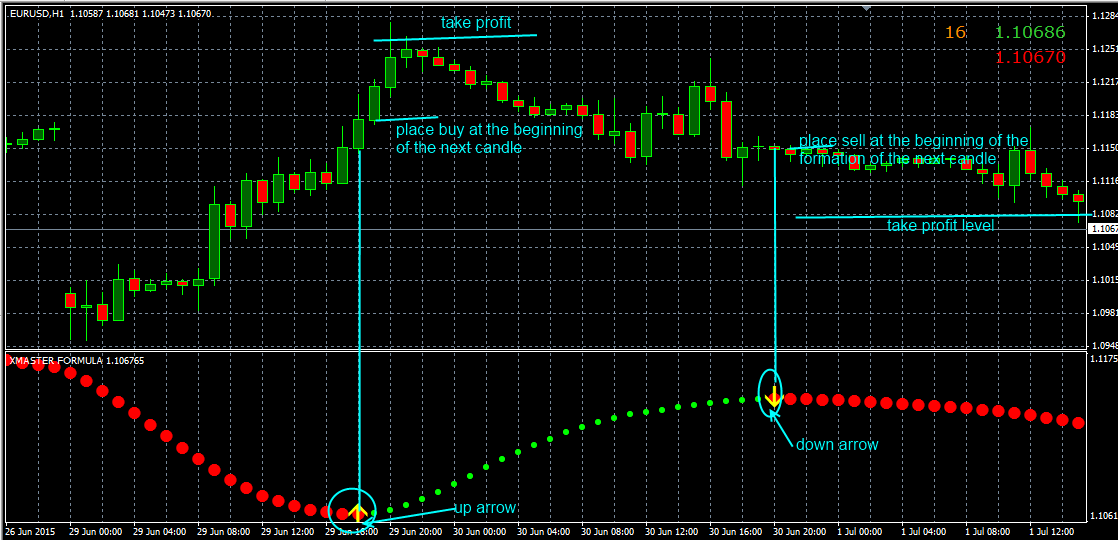
After placing the orders, the trader should wait for an opposite signal to be given for them to close the order. That is immediately an arrow facing the opposite direction is given, the trader should close the current running order; don’t wait to confirm the trend in this case. However this is not the best practice since the signal may be given too late and your trade may be in losses at the time. It is therefore advisable to use reasonable take profits. Don’t place stop losses if you are on the market full time; you will close the order if the take profit is not reached and an opposite signal is given.
Xmaster-Formula-Indicator . rar
Source : forexobroker.com


